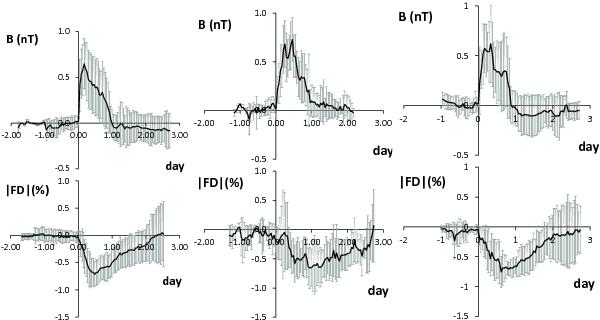
Fig. 4

Results of the superposed epoch analysis (FD magnitude, |FD|, and magnetic field enhancement, B) for different SWD types (left-ICMEs, middle-CIRs, right-mixed). Amplitudes in all events were normalized to 1. The time scale was normalized to the duration of the SWD magnetic field enhancement. The SEA curves are drawn with solid black lines, whereas vertical gray lines represent standard deviations.
Current usage metrics show cumulative count of Article Views (full-text article views including HTML views, PDF and ePub downloads, according to the available data) and Abstracts Views on Vision4Press platform.
Data correspond to usage on the plateform after 2015. The current usage metrics is available 48-96 hours after online publication and is updated daily on week days.
Initial download of the metrics may take a while.


