Fig. 4
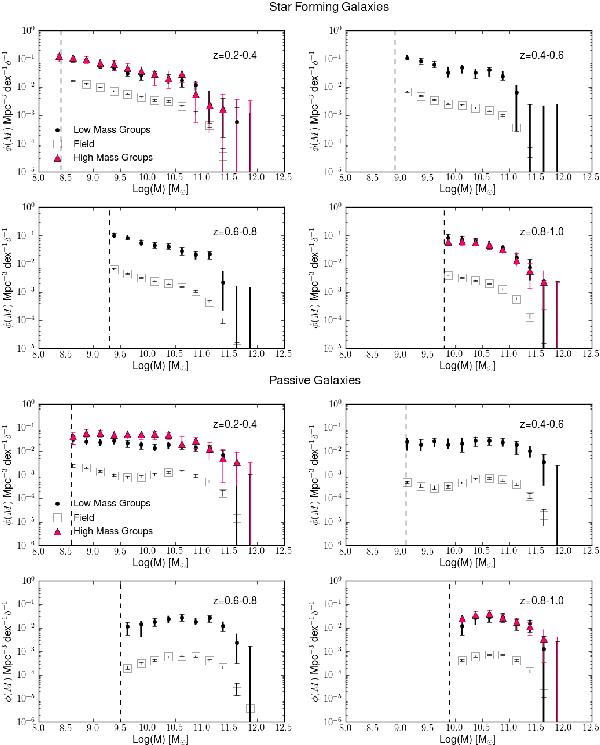
Upper plot: Galaxy stellar mass distributions of star-forming galaxies in the field (squares), low-mass groups (black points) and high-mass groups (magenta triangles). Different panels show different redshift bins. In each panel the vertical line marks the completeness stellar mass. The distributions are normalized to their respective overdensity δ (over the critical one) at the redshift considered. The values of δ used are 200 for the groups, while we assumed an overdensity of 1 for the field. Lower plot: same as the upper panel but for passive galaxies.
Current usage metrics show cumulative count of Article Views (full-text article views including HTML views, PDF and ePub downloads, according to the available data) and Abstracts Views on Vision4Press platform.
Data correspond to usage on the plateform after 2015. The current usage metrics is available 48-96 hours after online publication and is updated daily on week days.
Initial download of the metrics may take a while.