Fig. 2
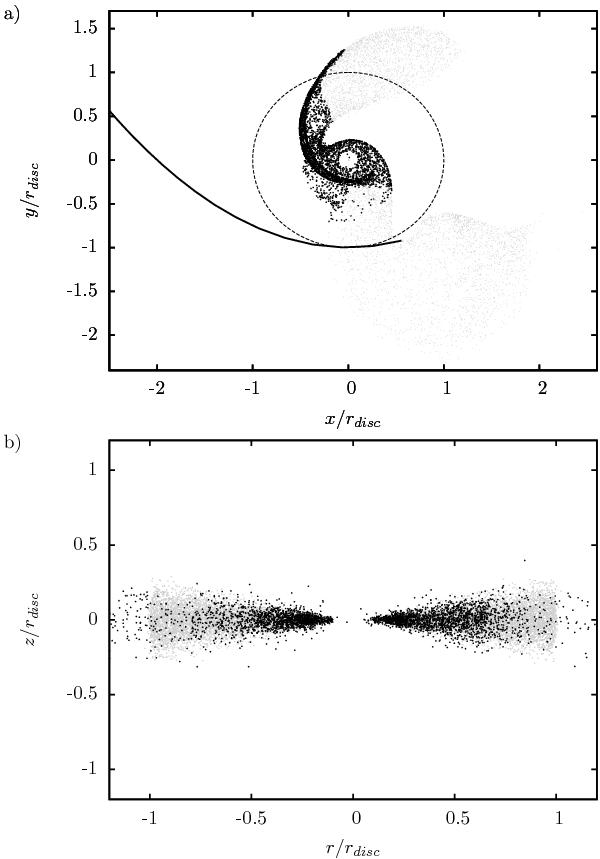
The dashed line in a) shows the boundaries of the initial disc while the solid line indicates the trajectory of a grazing perturber (rperi/rdisc = 1) of equal mass (M2/M1 = 1). Material that resides within the disc after the perturbation is marked as black squares, while material that is in the end either bound to the perturbing star, unbound, or accreted is shown as grey dots. We note that the simulations were performed in three dimensions as can be seen in b).
Current usage metrics show cumulative count of Article Views (full-text article views including HTML views, PDF and ePub downloads, according to the available data) and Abstracts Views on Vision4Press platform.
Data correspond to usage on the plateform after 2015. The current usage metrics is available 48-96 hours after online publication and is updated daily on week days.
Initial download of the metrics may take a while.