Free Access
Fig. 6
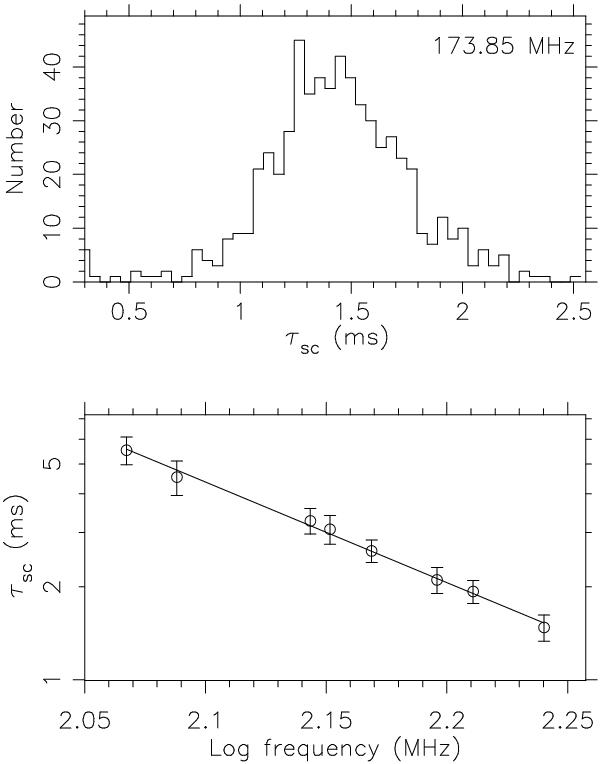
Plot showing scatter times from the model fits. The top panel shows the distribution of the scattering timescales in the band centred at 173.85 MHz. The bottom panel shows the average scattering timescales from the other bands.
Current usage metrics show cumulative count of Article Views (full-text article views including HTML views, PDF and ePub downloads, according to the available data) and Abstracts Views on Vision4Press platform.
Data correspond to usage on the plateform after 2015. The current usage metrics is available 48-96 hours after online publication and is updated daily on week days.
Initial download of the metrics may take a while.