Fig. 3
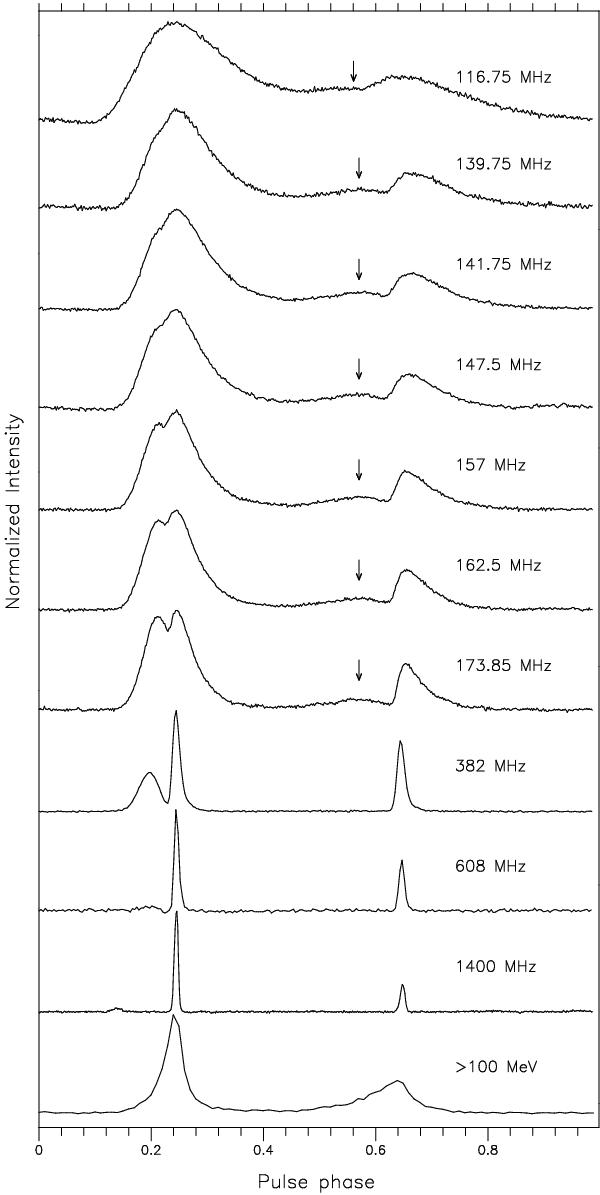
Plot showing the average emission profiles of the Crab pulsar at several frequencies observed at the WSRT arbitrarily aligned by the mainpulse peak. The first seven profiles are from the observations reported in this work, while profiles at 382, 608 and 1400 MHz are from the WSRT archives. The γ-ray profile is from Abdo et al. (2010). The arrow shows the location of the interpulse precursor emission component.
Current usage metrics show cumulative count of Article Views (full-text article views including HTML views, PDF and ePub downloads, according to the available data) and Abstracts Views on Vision4Press platform.
Data correspond to usage on the plateform after 2015. The current usage metrics is available 48-96 hours after online publication and is updated daily on week days.
Initial download of the metrics may take a while.