Fig. 1
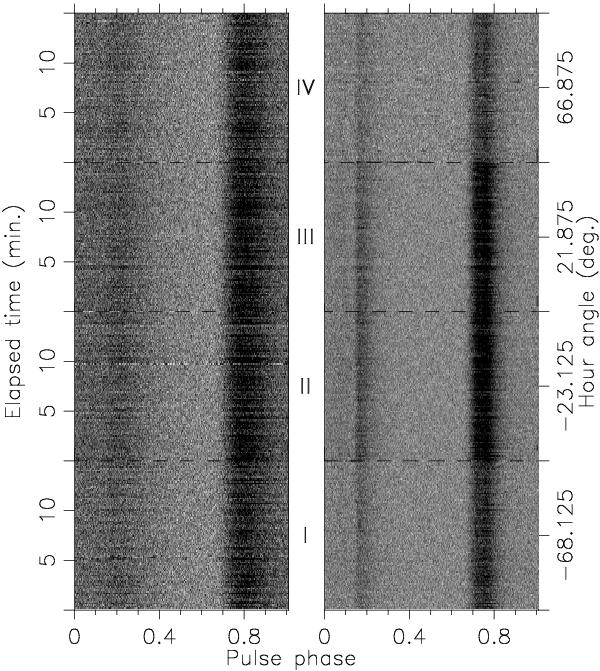
Plot of total intensity of Crab pulsar against time in the four observing sessions shown separated by dashed horizontal lines. The left panel corresponds to the band centred at 116.75 MHz, while the panel on the right is at 157 MHz. The elapsed time shown on the vertical axis is the observation time within each session. The vertical axis is labelled with the hour angle of the Crab pulsar on the right side of the second panel and corresponds to the middle of the 15-min observing sessions.
Current usage metrics show cumulative count of Article Views (full-text article views including HTML views, PDF and ePub downloads, according to the available data) and Abstracts Views on Vision4Press platform.
Data correspond to usage on the plateform after 2015. The current usage metrics is available 48-96 hours after online publication and is updated daily on week days.
Initial download of the metrics may take a while.