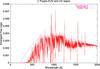
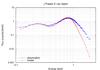
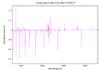
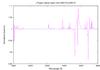
Fig. 7
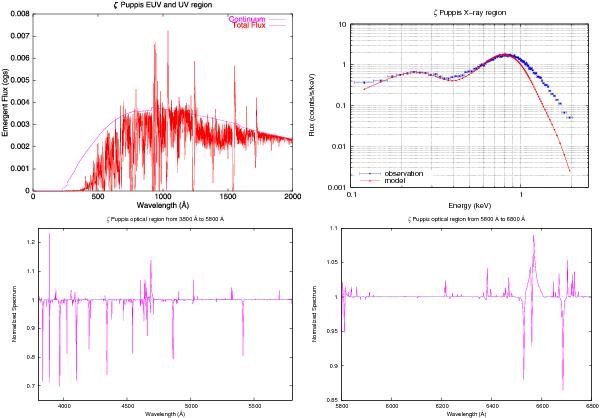
Further calculated spectra for ζ Puppis. Upper left: calculated state-of-the-art spectral energy distribution of the final model of ζ Puppis. Upper right: comparison of the ROSAT-observations (error bars) with the X-ray spectrum of the final model multiplied by the ROSAT PSPC response matrix (thick line)8. The calculated state-of-the-art optical spectrum of the final model of ζ Puppis is shown in the lower part. Lower left: spectral range from 3800 to 5800 Å. Lower right: spectral range from 5800 to 6800 Å.
Current usage metrics show cumulative count of Article Views (full-text article views including HTML views, PDF and ePub downloads, according to the available data) and Abstracts Views on Vision4Press platform.
Data correspond to usage on the plateform after 2015. The current usage metrics is available 48-96 hours after online publication and is updated daily on week days.
Initial download of the metrics may take a while.