Fig. 3
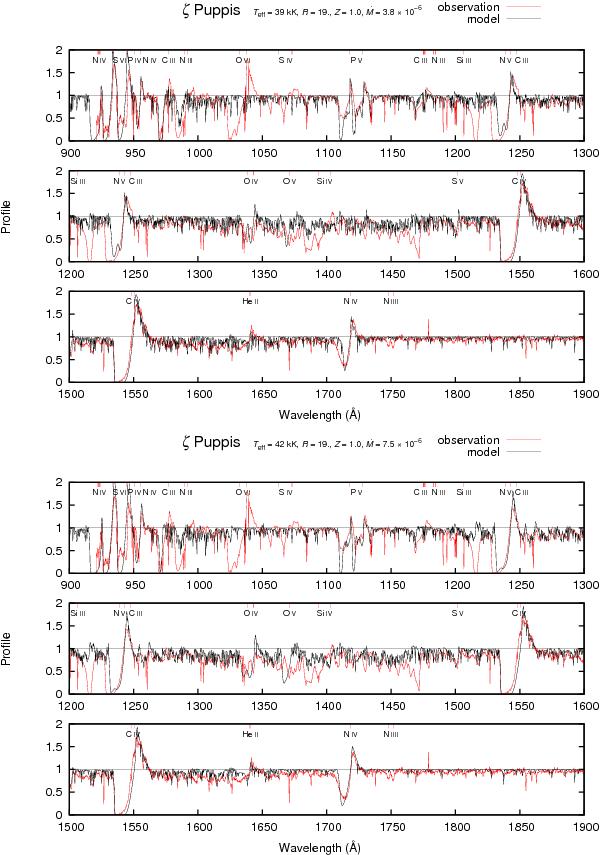
Calculated and observed UV spectra for ζ Puppis. The observed spectrum shows the Copernicus (Morton & Underhill 1977) and IUE (Walborn et al. 1985) high-resolution observations (thin line), and the calculated spectrum (thick line) represents the standard model with respect to the stellar parameters (model D+ – upper panel). The calculated spectrum in the lower panel represents also the standard model, however, here a value at the upper end has been chosen for Teff (model D−).
Current usage metrics show cumulative count of Article Views (full-text article views including HTML views, PDF and ePub downloads, according to the available data) and Abstracts Views on Vision4Press platform.
Data correspond to usage on the plateform after 2015. The current usage metrics is available 48-96 hours after online publication and is updated daily on week days.
Initial download of the metrics may take a while.