Fig. 24
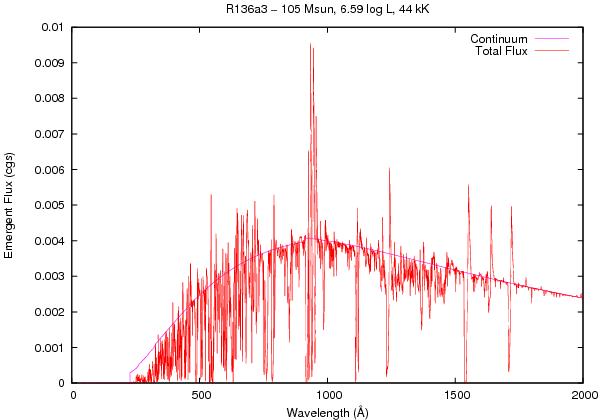
Calculated spectral energy distributions (Eddington flux Hν in cgs units) versus wavelength of our current best model (A∗) of R136a3. The spectrum contains, in addition to the typical P-Cygni profiles of the strong resonance lines, numerous absorption and emission lines above and below the continuum curve, illustrating that we are looking down into an extended photosphere similar to that of an O star. Thus, the behavior of the spectral energy distribution clearly shows that this model has an optically thin wind in the optical and observable UV continuum25.
Current usage metrics show cumulative count of Article Views (full-text article views including HTML views, PDF and ePub downloads, according to the available data) and Abstracts Views on Vision4Press platform.
Data correspond to usage on the plateform after 2015. The current usage metrics is available 48-96 hours after online publication and is updated daily on week days.
Initial download of the metrics may take a while.