Fig. 13
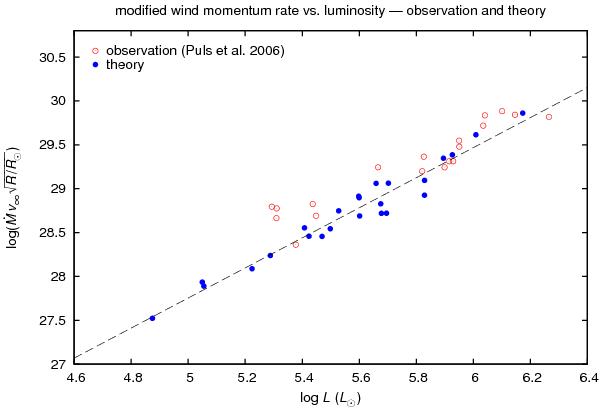
Wind momenta from the analysis by Puls et al. (2006) (open symbols) compared to our consistent wind dynamics (filled symbols). These latest mass loss determinations, accounting for enhanced Hα emission from wind clumping, do not indicate systematically higher mass loss rates for supergiants anymore. The dashed line is a simple linear fit to our predicted values, and has a shallower slope than the relation predicted by Vink et al. (2000) (cf. Fig. 12).
Current usage metrics show cumulative count of Article Views (full-text article views including HTML views, PDF and ePub downloads, according to the available data) and Abstracts Views on Vision4Press platform.
Data correspond to usage on the plateform after 2015. The current usage metrics is available 48-96 hours after online publication and is updated daily on week days.
Initial download of the metrics may take a while.