Fig. 9
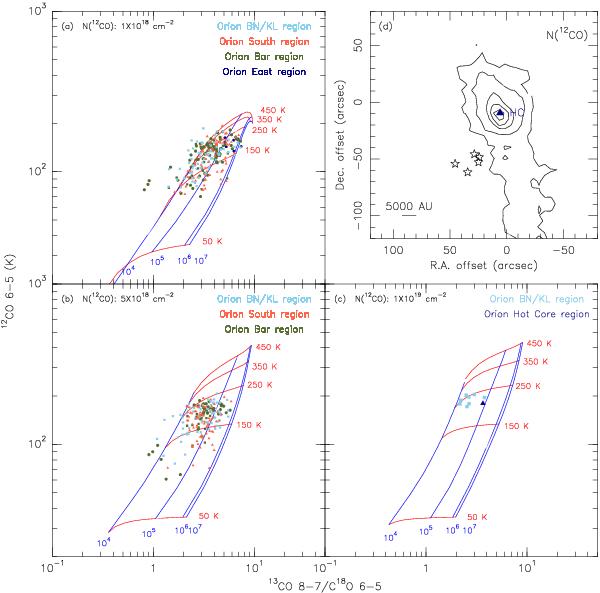
The RADEX modeling results shown in the 12CO J = 6−5 peak temperatures and the 13CO/C18O ratios for three different 12CO column densities. The column densities of 13CO and C18O were fixed at the isotopologic abundance ratio of 1/60 and 1/490 of the 12CO column density. The line widths of 12CO, 13CO, and C18O were fixed at 5, 5, and 4 km s-1, respectively. The red and blue contours denote the temperature and H2 number density, respectively, and the color points represent the data in the different regions of the OMC-1 core. Each point represents a peak 12CO J = 6−5 temperature and a temperature ratio between 13CO J = 8 − 7 and C18O J = 6−5 from a single pixel with a resolution of 20″. a) The modeling input column density of 12CO is 1 × 1018 cm-2, and the data are plotted in a 12CO column density density of 7.5 × 10¹⁷ − 2.5 × 1018 cm-2. b) The modeling input column density of 12CO is 5 × 1018 cm-2, and the data are plotted in a density range of 2.5 × 10¹⁸ − 7.5 × 1018 cm-2. c) The modeling input column density of 12CO is 1 × 1019 cm-2, and the data are plotted in the density of ≥7.5 × 1018 cm-2. Upper right panel shows the 12CO column density map toward Orion BN/KL in contours of 5, 10, 20, 30, and 40 × 1018 cm-2. The stars mark the positions of the five Trapezium stars, and the Orion Hot Core (HC) position is also marked.
Current usage metrics show cumulative count of Article Views (full-text article views including HTML views, PDF and ePub downloads, according to the available data) and Abstracts Views on Vision4Press platform.
Data correspond to usage on the plateform after 2015. The current usage metrics is available 48-96 hours after online publication and is updated daily on week days.
Initial download of the metrics may take a while.