Fig. 8
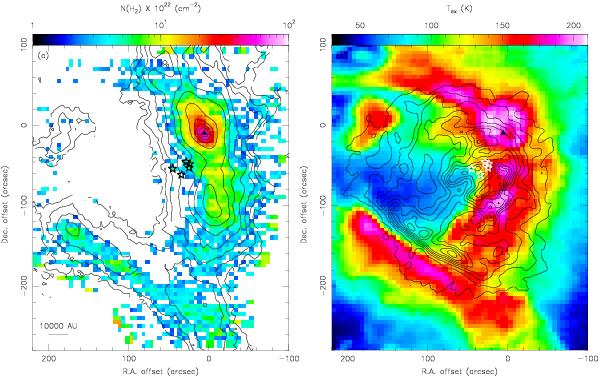
a) The C18O column density image of the OMC-1 core overlaid with black contours of the JCMT 850 μm dust continuum image. The 850 μm image is taken from the JCMT data archive. The contours represent 0.2%, 0.5%, 1%, 2%, 4%, 7%, 20%, 40%, 60%, and 80% of the peak intensity (87 Jy beam-1). b) The excitation temperature image for 12CO and C18O overlaid with the 35 mm VLA-GBT continuum emission (Dicker et al. 2009) in black contours running from 15% to 95% in steps of 8% of the peak intensity (0.94 Jy beam-1). The stars mark the positions of the five Trapezium stars, and black triangles represent the position of the Orion Hot Core.
Current usage metrics show cumulative count of Article Views (full-text article views including HTML views, PDF and ePub downloads, according to the available data) and Abstracts Views on Vision4Press platform.
Data correspond to usage on the plateform after 2015. The current usage metrics is available 48-96 hours after online publication and is updated daily on week days.
Initial download of the metrics may take a while.