Fig. 7
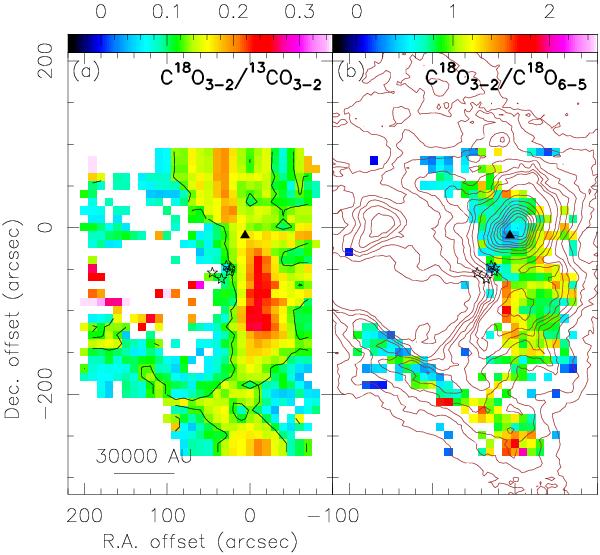
a) The OMC-1 core C18O J = 3−2 to 13CO J = 3−2 integrated intensity ratio map (θHPBW = 20″) overlaid with the 12CO J = 6−5 contours (grey) as shown in Fig. 1. The black contour represents the C18O/13CO abundance ratio of 0.122 (60/490). b) The OMC-1 core C18O J = 3−2 to J = 6−5 integrated intensity ratio map (θHPBW = 20″) overlaid with the 12CO J = 6−5 contours as shown in Fig. 1. Black triangles mark the Orion Hot Core position.
Current usage metrics show cumulative count of Article Views (full-text article views including HTML views, PDF and ePub downloads, according to the available data) and Abstracts Views on Vision4Press platform.
Data correspond to usage on the plateform after 2015. The current usage metrics is available 48-96 hours after online publication and is updated daily on week days.
Initial download of the metrics may take a while.