Fig. 6
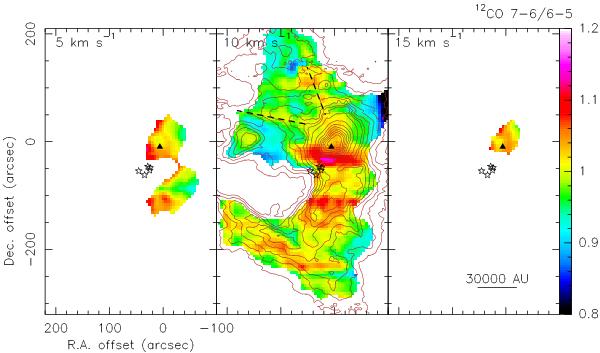
Velocity channel maps (5, 10, and 15 km s-1) of the 12CO J = 7−6 to J = 6−5 ratio (θHPBW = 10″) in the OMC-1 core. The 10 km s-1 image is overlaid with the 12CO J = 6−5 contours as shown in Fig. 1. The empty area are due to data blanking (3 σ level of the 12CO J = 7−6 temperature). The dashed-lines indicate that these ratio gradients are likely caused by outflows or filaments. Black triangles mark the Orion Hot Core position.
Current usage metrics show cumulative count of Article Views (full-text article views including HTML views, PDF and ePub downloads, according to the available data) and Abstracts Views on Vision4Press platform.
Data correspond to usage on the plateform after 2015. The current usage metrics is available 48-96 hours after online publication and is updated daily on week days.
Initial download of the metrics may take a while.