Fig. 5
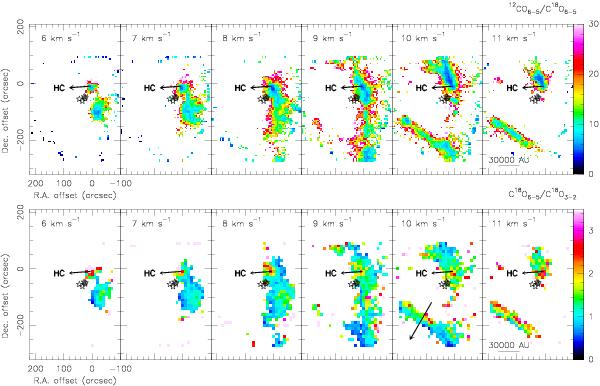
Upper panel is the 12CO J = 6−5 to C18O J = 6−5 ratio channel maps (θHPBW = 10″) at different velocities from 6 to 11 km s-1 in the OMC-1 core. The edge cut and empty area are due to different image sizes and data blanking (2 σ level of the C18O J = 6−5 temperature). Lower panel is the corresponding C18O J = 6−5 to J = 3−2 ratio channel maps (θHPBW = 20″). The black arrow in the 10 km s-1 image indicates the ratio gradient across the Orion Bar (see text). The Orion Hot Core (HC) position is marked, and Orion BN is located at the offset (0′′, 0′′). The positions of the five Trapezium stars are marked in each map.
Current usage metrics show cumulative count of Article Views (full-text article views including HTML views, PDF and ePub downloads, according to the available data) and Abstracts Views on Vision4Press platform.
Data correspond to usage on the plateform after 2015. The current usage metrics is available 48-96 hours after online publication and is updated daily on week days.
Initial download of the metrics may take a while.