Fig. 1
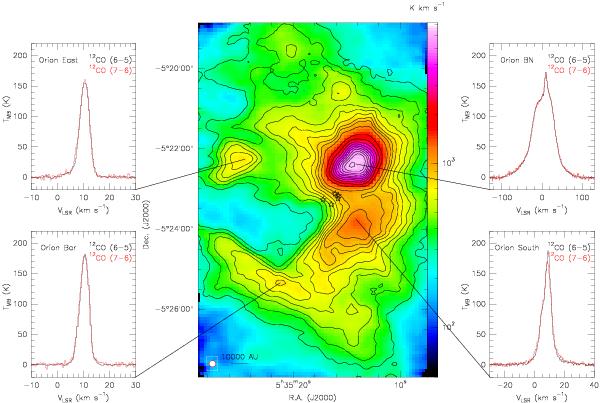
The OMC-1 core 12CO J = 6−5 integrated intensity [−25, + 30] km s-1 image overlaid with the J = 7−6 integrated intensity [− 25, + 30] km s-1 contours running from 300 to 1000 K km s-1 in steps of 100 K km s-1, and the subsequent contours are plotted from 1200 to 7200 K km s-1 in steps of 600 K km s-1. The 12CO J = 6−5 (black) and 12CO J = 7−6 (red) spectra are shown for Orion BN, Orion South, Orion Bar, and Orion East. Both images have been smoothed using Gaussian profiles (a width of 9 1 for 12CO J = 6−5 and 78 for 12CO J = 7−6) from their original Nyquist-sampled images. The black stars mark the positions of the five Trapezium stars (θ1 Ori A, B, C, D, and E). The original beam sizes are shown at the bottom left of the image for 12CO J = 6−5 and J = 7−6 in red (96) and white (82), respectively.
Current usage metrics show cumulative count of Article Views (full-text article views including HTML views, PDF and ePub downloads, according to the available data) and Abstracts Views on Vision4Press platform.
Data correspond to usage on the plateform after 2015. The current usage metrics is available 48-96 hours after online publication and is updated daily on week days.
Initial download of the metrics may take a while.