Fig. 6
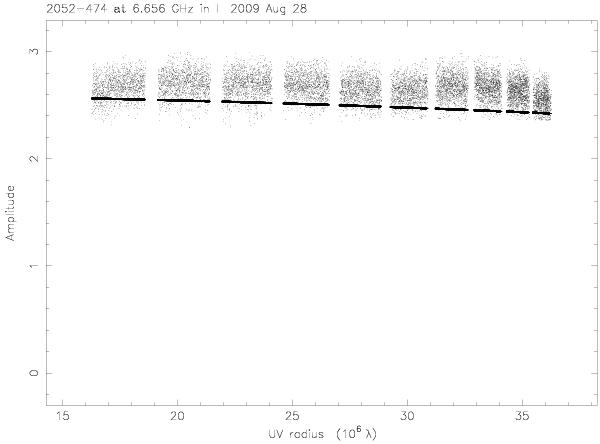
Amplitude vs. (u,v) distance plot of the calibrated 2052–474 CHI data. A model with major axis of 0.8 mas and an axial ratio of 1 well constrains the visibilities, giving an upper limit on the angular size of the source. Note the choice of model is not a fit to the data but rather lies below the majority of points to give an upper limit to the angular size.
Current usage metrics show cumulative count of Article Views (full-text article views including HTML views, PDF and ePub downloads, according to the available data) and Abstracts Views on Vision4Press platform.
Data correspond to usage on the plateform after 2015. The current usage metrics is available 48-96 hours after online publication and is updated daily on week days.
Initial download of the metrics may take a while.