Free Access
Fig. 3
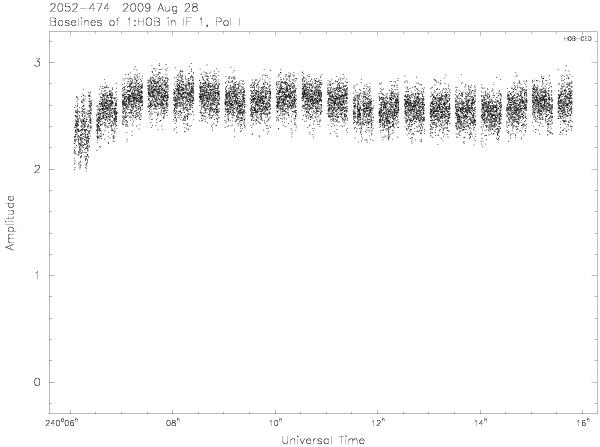
Amplitude vs. time plot for the calibrated 2052−474 observation. Note the downturn in amplitude at the beginning of the experiment. This corresponds to low elevation of the source and is thus likely a residual elevation effect. This is perhaps due to the simple nature of the gain-elevation curve for the Hobart Antenna.
Current usage metrics show cumulative count of Article Views (full-text article views including HTML views, PDF and ePub downloads, according to the available data) and Abstracts Views on Vision4Press platform.
Data correspond to usage on the plateform after 2015. The current usage metrics is available 48-96 hours after online publication and is updated daily on week days.
Initial download of the metrics may take a while.