Fig. 9
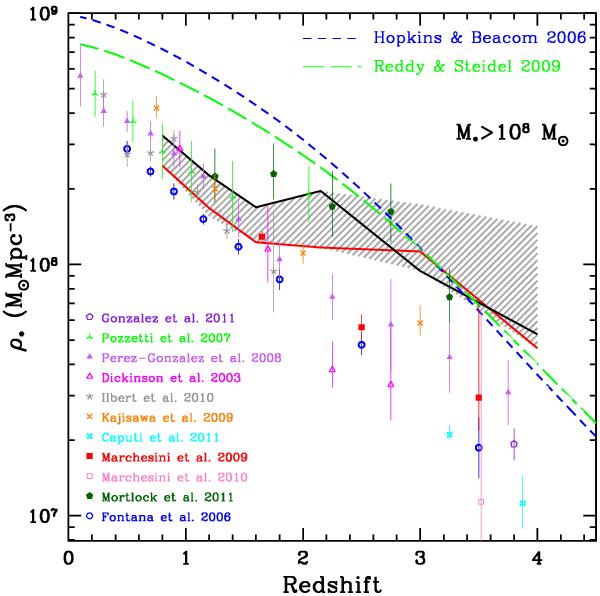
SMD between 108 and 1013 M⊙ versus redshift. The solid black and red curves are the integral of the STY Schechter fits using BC03 and CB07 templates, respectively. The grey shaded area shows the dispersion obtained when integrating the fit, with both a Schechter and a double power-law functional shape, of our 1/Vmax points together with those from the literature (see text and Fig. 8). Coloured symbols represent a compilation of results from the literature as listed in the legend (see text for their integration limits). All the points are scaled to the same cosmology and IMF. All the results are based on BC03 stellar templates, except the Caputi et al. (2011) work, which adopts the CB07 library. As far as Marchesini et al. (2010) results are concerned, the central redshift was shifted by 0.02 for visualization purposes; given their Table 6, the central values is reported and the error bar indicates the total scatter in their estimates. The blue dashed and green long-dashed lines show the integrated star formation history according to the best-fit relation from Hopkins & Beacom (2006) and Reddy & Steidel (2009), respectively.
Current usage metrics show cumulative count of Article Views (full-text article views including HTML views, PDF and ePub downloads, according to the available data) and Abstracts Views on Vision4Press platform.
Data correspond to usage on the plateform after 2015. The current usage metrics is available 48-96 hours after online publication and is updated daily on week days.
Initial download of the metrics may take a while.