Fig. 8
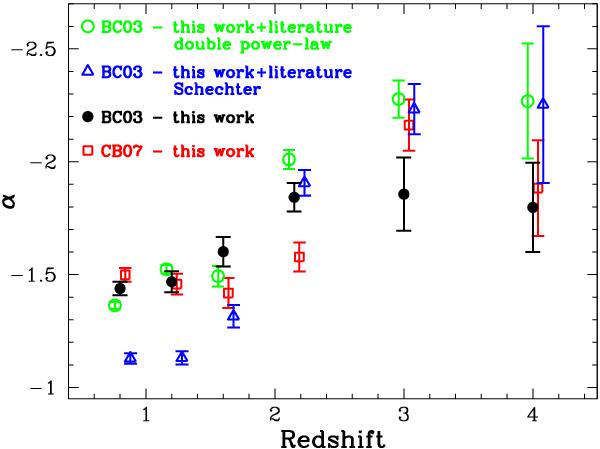
Faint-end slope as a function of redshift. The parameter α was computed through a maximum-likelihood analysis with a Schechter form (black solid circles refer to the BC03 library, red open boxes refer to the CB07 one) and by fitting the ensemble (this study + previous surveys) of 1/Vmax points with a Schechter parametric form (blue open triangles) and a double power-law shape (see text, green open circles). The different sets are shifted in redshift with respect to the central values in each interval (shown by the solid black circles).
Current usage metrics show cumulative count of Article Views (full-text article views including HTML views, PDF and ePub downloads, according to the available data) and Abstracts Views on Vision4Press platform.
Data correspond to usage on the plateform after 2015. The current usage metrics is available 48-96 hours after online publication and is updated daily on week days.
Initial download of the metrics may take a while.