Free Access
Fig. 6
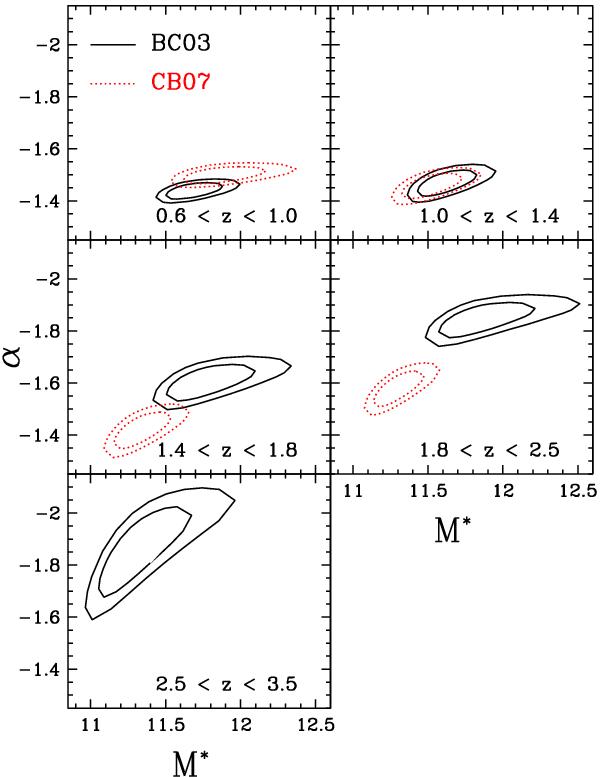
The α and M∗ space (1σ and 2σ contours) resulting from the maximum-likelihood analysis. Black solid curves refer to BC03-based GSMFs, red dotted curves refer to CB07-based ones.
Current usage metrics show cumulative count of Article Views (full-text article views including HTML views, PDF and ePub downloads, according to the available data) and Abstracts Views on Vision4Press platform.
Data correspond to usage on the plateform after 2015. The current usage metrics is available 48-96 hours after online publication and is updated daily on week days.
Initial download of the metrics may take a while.