Fig. 3
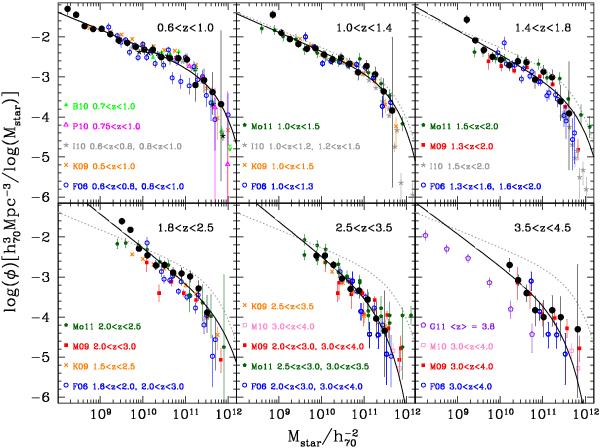
GSMFs obtained with BC03 stellar templates in different redshift ranges compared with previous works. Black solid circles represent our analysis with the 1/Vmax method, black solid lines show the best-fit to a Schechter function according to the STY approach. The grey dotted line replicates the best-fit Schechter function at z ~ 0.8 in the higher redshift panels. Error bars include the uncertainties in the stellar masses as well as Poissonian errors. The highest mass points are often poorly determined, because of the large statistical error, resulting from our poor sampling of the massive side. Other symbols represent the 1/Vmax results of previous works, scaled to the same cosmology and converted to the same IMF: Fontana et al. (2006): open blue circles (F06); Bolzonella et al. (2010): solid green triangles (B10); Pozzetti et al. (2010): open purple triangles (P10); Ilbert et al. (2010): grey stars (I10); Kajisawa et al. (2009): orange crosses (K09); Marchesini et al. (2009): solid red boxes (M09); Marchesini et al. (2010): open pink boxes (M10); Mortlock et al. (2011): solid dark green pentagons (Mo11); González et al. (2011): open violet pentagons (G11). All the literature works considered for the comparison adopted the same stellar templates as this study. The legend shows the redshift intervals in which each set of points was computed.
Current usage metrics show cumulative count of Article Views (full-text article views including HTML views, PDF and ePub downloads, according to the available data) and Abstracts Views on Vision4Press platform.
Data correspond to usage on the plateform after 2015. The current usage metrics is available 48-96 hours after online publication and is updated daily on week days.
Initial download of the metrics may take a while.