Fig. 2
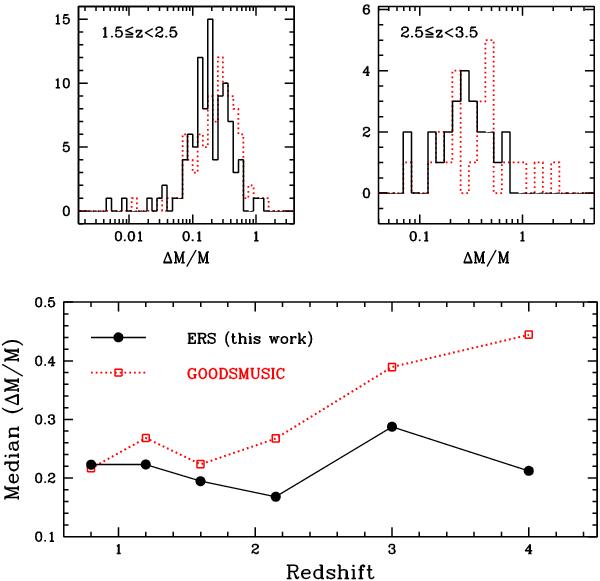
Upper: distribution of the ΔM/M ratio, where ΔM is the average 1σ error bar for each object, at z ~ 2 (left) and z ~ 3 (right). Black solid histograms refer to the GOODS-ERS sample, whereas red dotted ones represent the GOODS-MUSIC data set. Lower: median ΔM/M in each of the redshift bins used in this work as a function of the central redshift for GOODS-ERS (black solid circles/solid lines) and GOODS-MUSIC (red open boxes/dotted lines).
Current usage metrics show cumulative count of Article Views (full-text article views including HTML views, PDF and ePub downloads, according to the available data) and Abstracts Views on Vision4Press platform.
Data correspond to usage on the plateform after 2015. The current usage metrics is available 48-96 hours after online publication and is updated daily on week days.
Initial download of the metrics may take a while.