Fig. 10
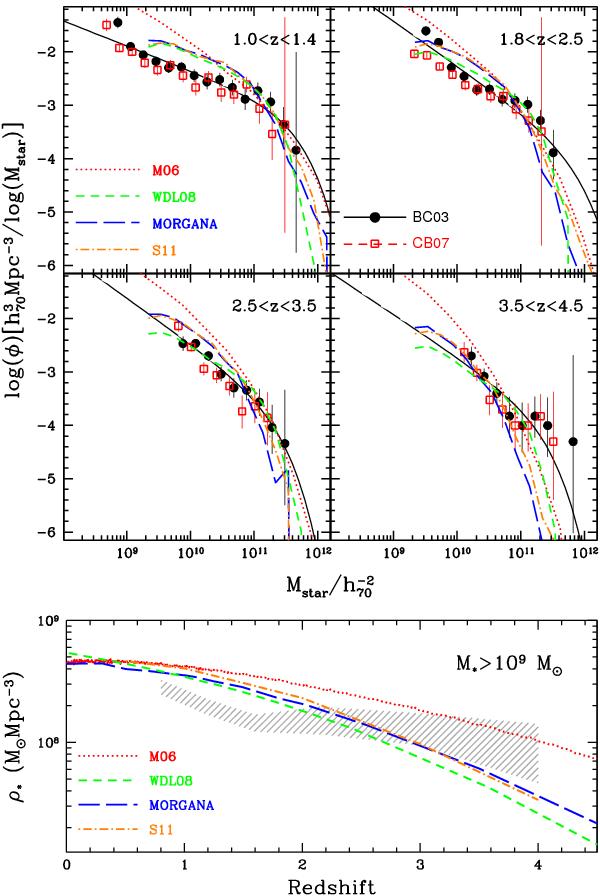
Observed GSMFs in different redshift ranges (upper) and observed SMD between 109 and 1013 M⊙ (lower) compared with theoretical predictions, shown as coloured curves. Red dotted curves: Menci et al. (2006). Blue long-dashed curves: MORGANA (Monaco et al. 2007). Green dashed curves: Wang et al. (2008). Orange dot-dashed curves: Somerville et al. (2011). Black solid circles, solid lines, red open boxes, and the grey shaded area show the results of the present work as in Figs. 5 and 9.
Current usage metrics show cumulative count of Article Views (full-text article views including HTML views, PDF and ePub downloads, according to the available data) and Abstracts Views on Vision4Press platform.
Data correspond to usage on the plateform after 2015. The current usage metrics is available 48-96 hours after online publication and is updated daily on week days.
Initial download of the metrics may take a while.