Fig. 7
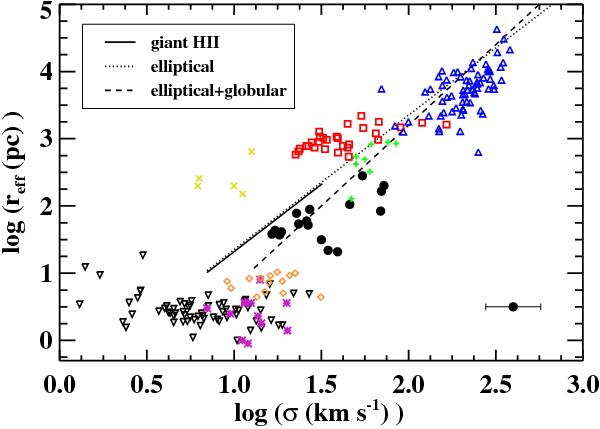
Velocity dispersion vs. estimated effective radius. Dots correspond to the relation for our selected complexes. The typical size for errors is shown in the bottom right corner. The lines show the fit for extragalactic HII regions (continuous), elliptical galaxies (dashed) and globular + elliptical galaxies (dotted) obtained by Terlevich & Melnick (1981). The other symbols represent different samples of dynamically hot systems: open triangles in blue, intermediate and giant ellipticals (Bender et al. 1992); open squares in red, dwarf ellipticals (Bender et al. 1992; Geha et al. 2003); crosses in yellow, dwarf spheroidals (Bender et al. 1992); plusses in green, the TDG candidates in Monreal-Ibero et al. (2007); diamonds in orange, massive globular clusters in NGC 5128 (Martini & Ho 2004); inverse triangles, globular clusters in the Galaxy (Trager et al. 1993) and in M 31 (Dubath & Grillmair 1997); and asterisks in pink, clusters in the Antennae (Mengel et al. 2008).
Current usage metrics show cumulative count of Article Views (full-text article views including HTML views, PDF and ePub downloads, according to the available data) and Abstracts Views on Vision4Press platform.
Data correspond to usage on the plateform after 2015. The current usage metrics is available 48-96 hours after online publication and is updated daily on week days.
Initial download of the metrics may take a while.