Fig. 6
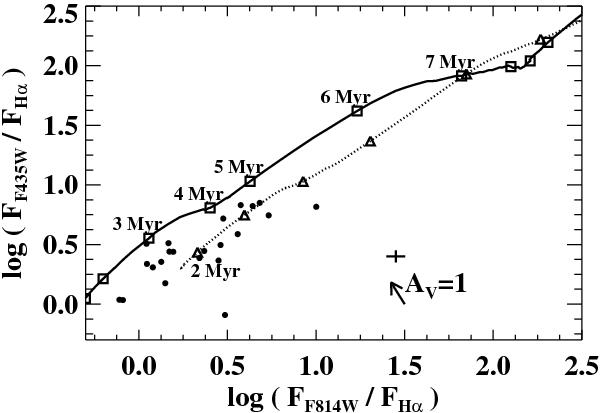
Flux ratios of the blue and red filters when the Hα emission can be measured in a complex. The broad-band filter fluxes have been multiplied by the band-width to obtain the values with the same units as the Hα flux. Solid line shows the evolutionary track of the same ratios for a single burst using SB99 models (see text). Dotted line shows the track for a composite population where 99% of the mass corresponds to a 1 Gyr population. The small triangle almost at the beginning (zero-age young population) of the second track indicates that the young population is 2 Myr old and we add 1 Myr to the subsequent triangles. The typical uncertainty associated with the data is shown above the extinction vector, which is drawn at the bottom right-hand corner.
Current usage metrics show cumulative count of Article Views (full-text article views including HTML views, PDF and ePub downloads, according to the available data) and Abstracts Views on Vision4Press platform.
Data correspond to usage on the plateform after 2015. The current usage metrics is available 48-96 hours after online publication and is updated daily on week days.
Initial download of the metrics may take a while.