Fig. 3
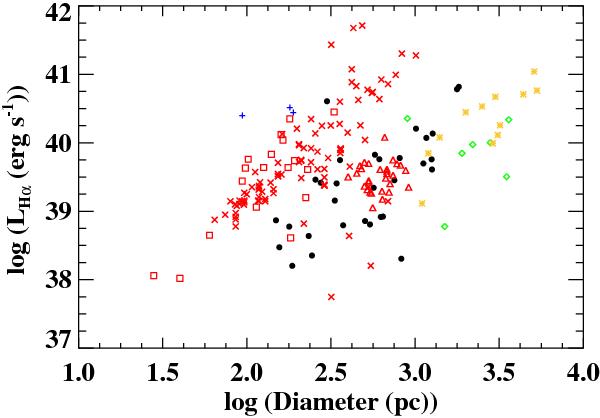
Relation between the Hα luminosity and the size of the identified Hα complexes in our sample (black dots), extremely luminous Hα complexes in the Antennae (blue plusses; Bastian et al. 2006), different samples of isolated giant HII regions in spirals and minor mergers (red symbols; Terlevich & Melnick 1981; Ferreiro & Pastoriza 2004; Rozas et al. 2006a), TDG candidates in CG J1720-67.8 (green diamonds; Temporin et al. 2003) and nearby dwarf amorphous (yellow crosses; Marlowe et al. 1997). None on the luminosities on the plot are corrected for internal extinction.
Current usage metrics show cumulative count of Article Views (full-text article views including HTML views, PDF and ePub downloads, according to the available data) and Abstracts Views on Vision4Press platform.
Data correspond to usage on the plateform after 2015. The current usage metrics is available 48-96 hours after online publication and is updated daily on week days.
Initial download of the metrics may take a while.