Fig. 1
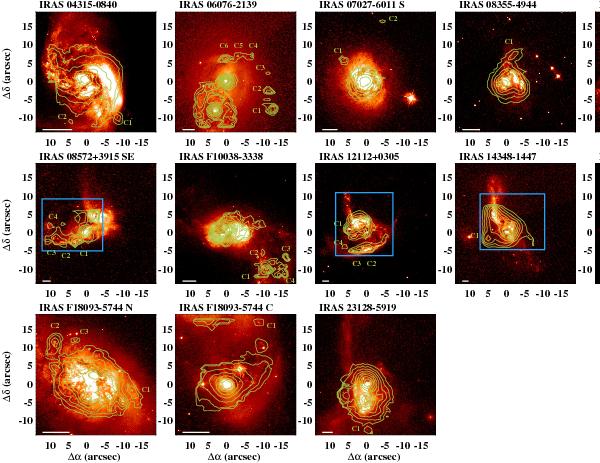
Systems under study with the Hα maps obtained from integral field spectroscopy. The F435W ACS images are shown and contours corresponding to the Hα are over-plotted. The contours are in arbitrary units, optimized to show and identify the structures of the Hα complexes. In some cases, there are two different pointings for the same system. The labels show the location of the complexes under study. The horizontal line at the bottom left corner shows a scale of 2.5 kpc. The VIMOS FoV is shown approximately. For INTEGRAL sources, the INTEGRAL FoV is over-plotted in the blue boxes. Most of the Hα peaks match up with several knots identified in the blue images. Note that the brightest knot on the Hα clump below C1 corresponds to a red foreground star, not a knot of star formation.
Current usage metrics show cumulative count of Article Views (full-text article views including HTML views, PDF and ePub downloads, according to the available data) and Abstracts Views on Vision4Press platform.
Data correspond to usage on the plateform after 2015. The current usage metrics is available 48-96 hours after online publication and is updated daily on week days.
Initial download of the metrics may take a while.