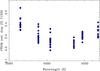
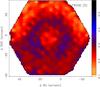
Fig. 9

Left panel: the distribution of the FWHM of the instrumental dispersion derived from the analysis of the emission lines within the arc-lamp frames at different wavelengths and different positions within the FoV, for the V1200 data. Right panel: the spatial distribution of the average FWHM of the instrumental dispersion, derived from the same arc lines.
Current usage metrics show cumulative count of Article Views (full-text article views including HTML views, PDF and ePub downloads, according to the available data) and Abstracts Views on Vision4Press platform.
Data correspond to usage on the plateform after 2015. The current usage metrics is available 48-96 hours after online publication and is updated daily on week days.
Initial download of the metrics may take a while.