Free Access
Fig. 8
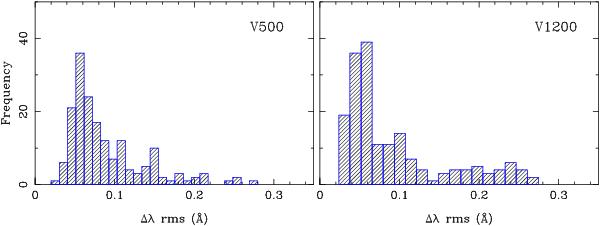
Distribution of the rms of the difference between the nominal and measured wavelengths of the night-sky emission lines, derived from the statistical analysis of all the considered emission lines within the same science frame for the V500 (left panel) and V1200 (right panel) grating datasets. The mean shift is around zero.
This figure is made of several images, please see below:
Current usage metrics show cumulative count of Article Views (full-text article views including HTML views, PDF and ePub downloads, according to the available data) and Abstracts Views on Vision4Press platform.
Data correspond to usage on the plateform after 2015. The current usage metrics is available 48-96 hours after online publication and is updated daily on week days.
Initial download of the metrics may take a while.