Fig. 6
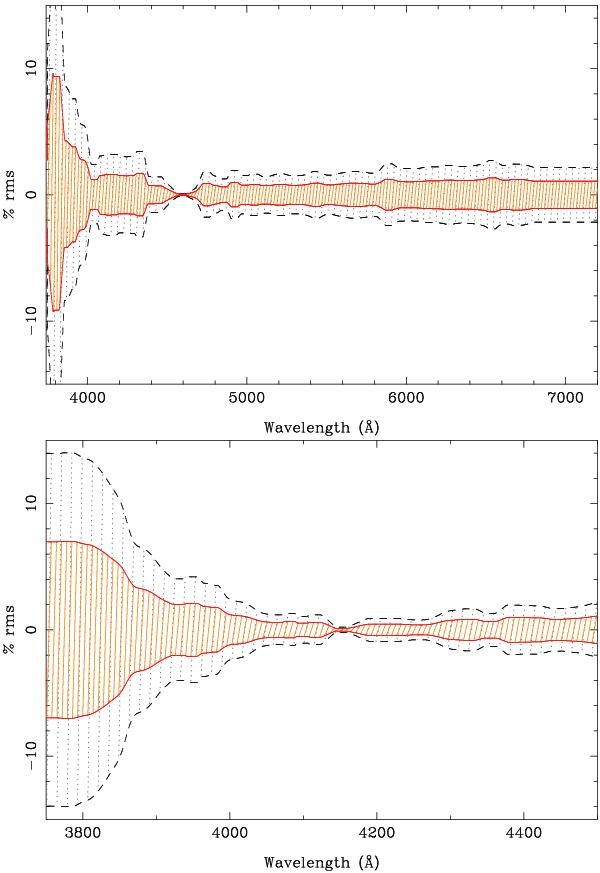
Relative differences, in percent, between the response curves found on different nights for the V500 grating dataset (top panel) and the V1200 grating (bottom panel), as a function of wavelength, normalized to unity at 4600 Å and 4150 Å, respectively. The solid hashed region (and red solid line) shows the 1σ error, while the dashed hashed region (and black dashed line) shows the 2σ error.
Current usage metrics show cumulative count of Article Views (full-text article views including HTML views, PDF and ePub downloads, according to the available data) and Abstracts Views on Vision4Press platform.
Data correspond to usage on the plateform after 2015. The current usage metrics is available 48-96 hours after online publication and is updated daily on week days.
Initial download of the metrics may take a while.