Fig. 4
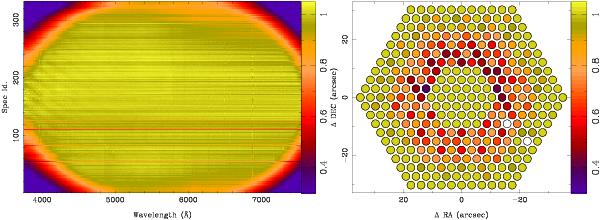
Left panel: intensity map of the differential transmission fiber-to-fiber for the V500-grating (known as fiber-flat), corresponding to the night of the 10th of June 2010. The effects of vignetting are clearly visible with a significant drop of the transmission at the edges of the image. Right panel: spatial distribution of the fraction of pixels free of vignetting, when adopting a conservative criterion of 75% of the average transmission in the central fibers. Two fibers at the bottom/right show a transmission below this limit in the whole wavelength range.
Current usage metrics show cumulative count of Article Views (full-text article views including HTML views, PDF and ePub downloads, according to the available data) and Abstracts Views on Vision4Press platform.
Data correspond to usage on the plateform after 2015. The current usage metrics is available 48-96 hours after online publication and is updated daily on week days.
Initial download of the metrics may take a while.