Fig. 3
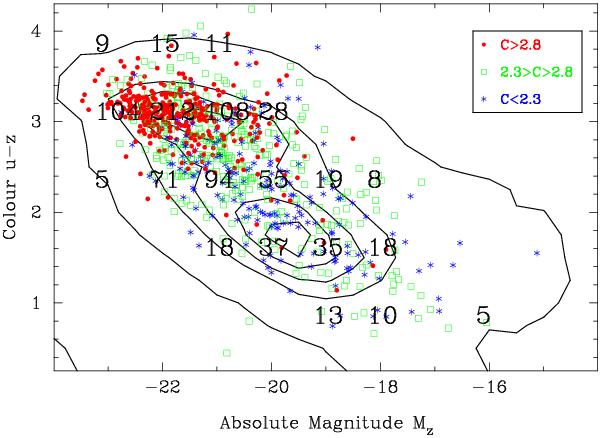
Distribution of the CALIFA mother sample in the u − z vs. Mz colour-magnitude diagram. The overplotted numbers indicate the number of galaxies in bins of 1 mag in Mr and 0.75 mag in u − z. Different colours and symbols represent a classification into bulge- and disk-dominated galaxies as well as intermediate cases, as suggested by the concentration index C. For comparison, the contours delineate the number density distribution of galaxies in the SDSS-NYU catalogue (e.g., Blanton et al. 2005).
Current usage metrics show cumulative count of Article Views (full-text article views including HTML views, PDF and ePub downloads, according to the available data) and Abstracts Views on Vision4Press platform.
Data correspond to usage on the plateform after 2015. The current usage metrics is available 48-96 hours after online publication and is updated daily on week days.
Initial download of the metrics may take a while.