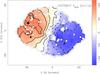
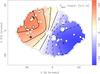
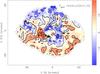
Fig. 29

Results from thegas kinematics analysis. The left panel shows the Hα velocity map of NGC 5947 shown in Fig. 27. The central panel shows the best-fit model assuming a simple arctan-rotational curve. Finally the right panel shows the residual after subtracting the model to the velocity map. The spaxels not used in the fitting procedure have been masked. Contours indicate different velocity levels, with constant step of 30 km s-1 in the first two panels, and 10 km s-1 in the last one.
Current usage metrics show cumulative count of Article Views (full-text article views including HTML views, PDF and ePub downloads, according to the available data) and Abstracts Views on Vision4Press platform.
Data correspond to usage on the plateform after 2015. The current usage metrics is available 48-96 hours after online publication and is updated daily on week days.
Initial download of the metrics may take a while.