Fig. 26
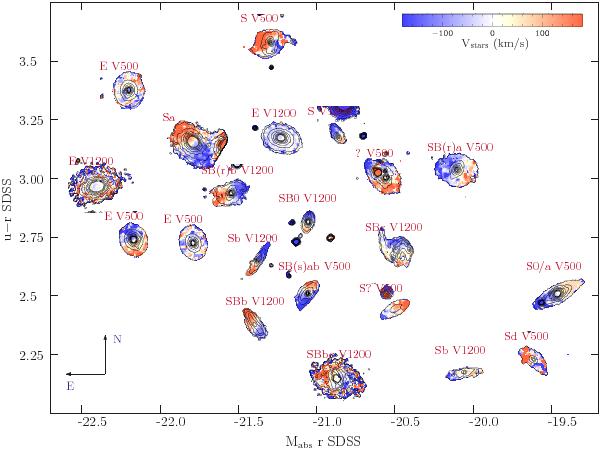
Color maps showing the velocity field of the stellar component from the V1200-grating dataset in a color–magnitude diagram similar to that of Fig. 21. For those galaxies for which the 3σ limiting surface brightness per spaxel was brighter than 22 mag/arcsec2, the velocity map was derived from V500 dataset. The contours show the intensity level of the continuum emission at ~4000 Å, for the same levels as in Fig. 21.
Current usage metrics show cumulative count of Article Views (full-text article views including HTML views, PDF and ePub downloads, according to the available data) and Abstracts Views on Vision4Press platform.
Data correspond to usage on the plateform after 2015. The current usage metrics is available 48-96 hours after online publication and is updated daily on week days.
Initial download of the metrics may take a while.