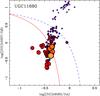
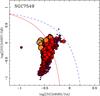
Fig. 23

[OIII]λ5007/Hβ vs. [NII]λ6583/Hα diagnostic diagram for the individual spectra within the V500 datacubes corresponding to two different objects, UGC 11680 (left panel) and NGC 7549 (right panel) in the currently observed CALIFA sample. The solid and dashed-lines are similar to those shown in Fig. 20. The size and colors of the symbols indicate the distance to the center of the galaxy, with bluer and smaller circles located in the inner regions and orange and larger ones located in the outer parts.
Current usage metrics show cumulative count of Article Views (full-text article views including HTML views, PDF and ePub downloads, according to the available data) and Abstracts Views on Vision4Press platform.
Data correspond to usage on the plateform after 2015. The current usage metrics is available 48-96 hours after online publication and is updated daily on week days.
Initial download of the metrics may take a while.