Fig. 21
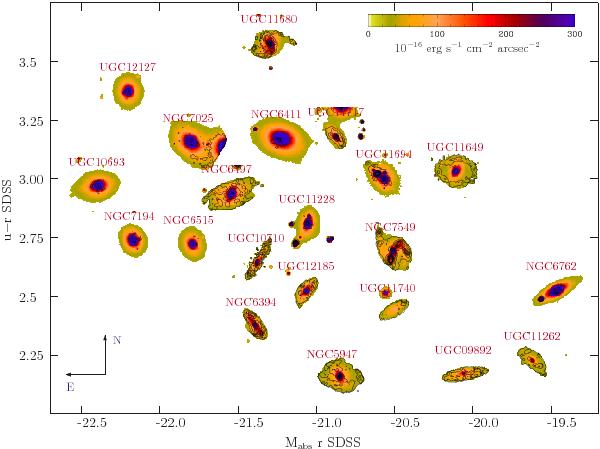
Color magnitude diagram of the galaxies currently observed within CALIFA, for the SDSS u − r observed colors versus the r-band absolute magnitude. For each galaxy we plot in color a map for the continuum intensity at ~6550 Å down to a surface brightness of ~23 mag/arcsec2 AB ( > 3σ detection limit per spaxel), together with a contour plot of the Hα emission (if detected), derived by the fitting procedure described in the text (applied to the V500 data). The contours start at 0.3 × 10⁻¹⁶ erg s-1 cm-2 arcsec-2, and are spaced on a logarithmic scale, following the equation f = 0.3 + N1.5 (0.3,1.3,3.1,5.5...). The NED name of the galaxies has been included, together with the orientation of the map on the sky. Note that some images have been shifted by up to ± 0.5 mag around the nominal color–magnitude coordinate to avoid overlap. Nearby (projected) companions (e.g., NGC 7025) and foreground stars have not been masked (e.g., UGC 11694, UGC 11717).
Current usage metrics show cumulative count of Article Views (full-text article views including HTML views, PDF and ePub downloads, according to the available data) and Abstracts Views on Vision4Press platform.
Data correspond to usage on the plateform after 2015. The current usage metrics is available 48-96 hours after online publication and is updated daily on week days.
Initial download of the metrics may take a while.