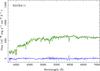
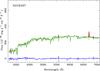
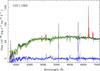
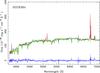
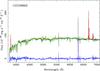
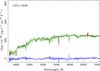
Fig. 16
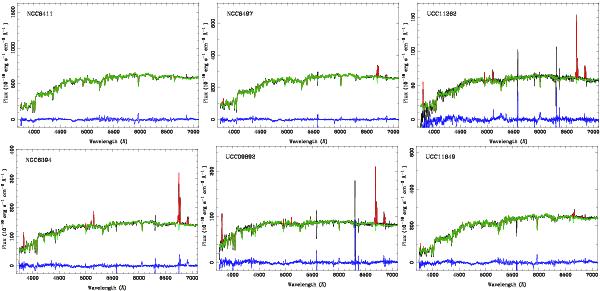
Results of the fitting procedure applied to each single spectrum contained in the dataset, described in the text, for the six galaxies shown in Figs. 7 and 15. Each panel shows the integrated spectrum of the corresponding galaxy (solid-black line) derived by coadding the spectra within a 30″ diameter aperture centered on the peak emission in the V-band. The green line shows the best-fit multi-SSP stellar population, while the red line shows the best model derived for the emission of ionized gas. The blue line is the residual from the fit.
Current usage metrics show cumulative count of Article Views (full-text article views including HTML views, PDF and ePub downloads, according to the available data) and Abstracts Views on Vision4Press platform.
Data correspond to usage on the plateform after 2015. The current usage metrics is available 48-96 hours after online publication and is updated daily on week days.
Initial download of the metrics may take a while.