Fig. 14
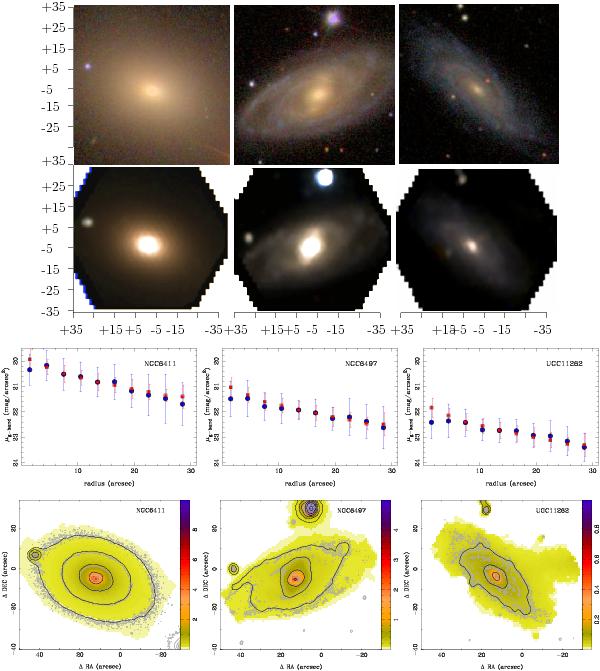
Three-color images from the SDSS imaging survey (first panel), vs. those obtained from the V500 CALIFA data (second panel), for the same objects shown in Fig. 7: NGC 6411 (left), NGC 6497 (middle) and UGC 11262 (right). For the CALIFA data, u, g and r-band images were synthesized from the corresponding datacubes. The third panel shows a comparison between the azimuthal averaged surface brightness profiles at the g-band, derived from synthesized images created from the V500 datacubes (blue circles) and the SDSS ones (red squares). The bottom panel shows the synthesized g-band image, color-scaled, together with two logarithm-scaled counter plots: one corresponding to the SDSS g-band image, in grey color, and the other corresponding to the synthesized image, in black.
Current usage metrics show cumulative count of Article Views (full-text article views including HTML views, PDF and ePub downloads, according to the available data) and Abstracts Views on Vision4Press platform.
Data correspond to usage on the plateform after 2015. The current usage metrics is available 48-96 hours after online publication and is updated daily on week days.
Initial download of the metrics may take a while.