Fig. 13
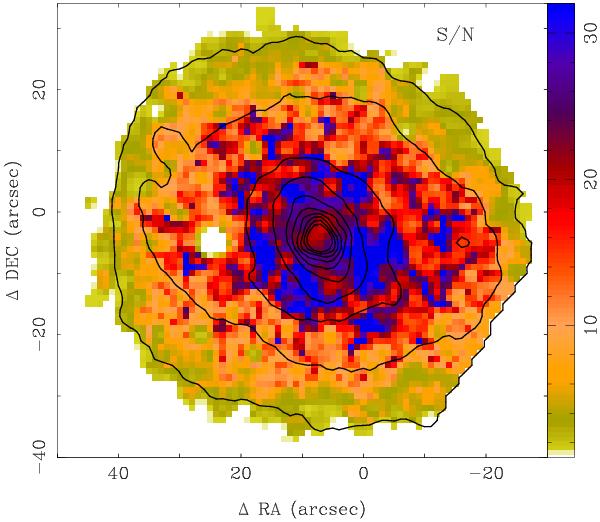
Color image of the signal-to-noise map derived for the V500 data corresponding to the continuum emission of the NGC 5947 galaxy at the wavelength range between 4480 and 4520 Å, based on the rough estimation described in the text. The contours shows the intensity of the V-band image synthesized from the datacube, with the 1st contour at 1.5 × 10⁻¹⁸ erg s-1 cm-2 arcsec-2 (~23.5 mag/arcsec2) and consecutive ones with a step of 3 × 10-18 erg s-1 cm-2 arcsec-2.
Current usage metrics show cumulative count of Article Views (full-text article views including HTML views, PDF and ePub downloads, according to the available data) and Abstracts Views on Vision4Press platform.
Data correspond to usage on the plateform after 2015. The current usage metrics is available 48-96 hours after online publication and is updated daily on week days.
Initial download of the metrics may take a while.