Free Access
Fig. 10
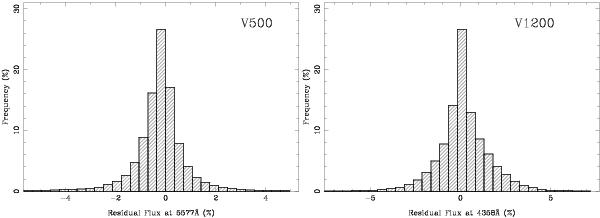
Distribution of the relative residual flux after subtracting the night-sky spectrum for the strongest emission lines on the corresponding wavelength range covered by each setup: [OI]λ5577 for the V500 grating (left panel) and HgIλ4358 for the V1200 grating (right panel).
This figure is made of several images, please see below:
Current usage metrics show cumulative count of Article Views (full-text article views including HTML views, PDF and ePub downloads, according to the available data) and Abstracts Views on Vision4Press platform.
Data correspond to usage on the plateform after 2015. The current usage metrics is available 48-96 hours after online publication and is updated daily on week days.
Initial download of the metrics may take a while.