Fig. 9
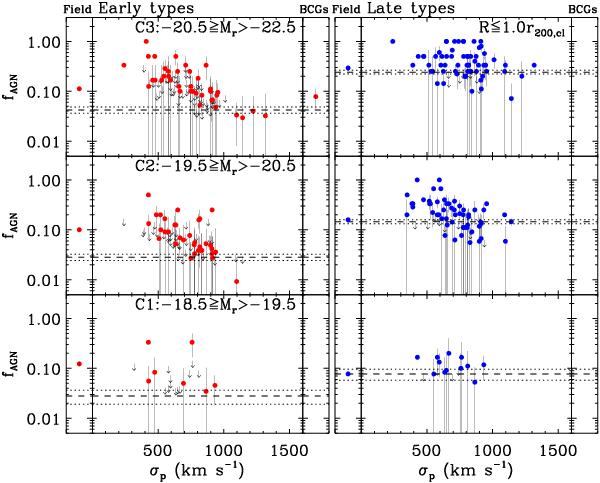
AGN fraction (fAGN) as a function of velocity dispersion of galaxy clusters. Left and right panels are for early- and late-type galaxies, respectively. fAGN is computed in the sample of galaxies [C1(bottom) − C3(top)] within the virial radius of the clusters (R ≤ r200,cl). Clusters with fAGN = 0 are indicated by arrows at the positions of upper limits. Horizontal dashed line indicates the mean fAGN using all the cluster galaxies in the sample, and dotted lines are its errors. fAGN in the sample of field galaxies (R > r200,cl) and of BCGs is shown to the left and right of each panel, respectively.
Current usage metrics show cumulative count of Article Views (full-text article views including HTML views, PDF and ePub downloads, according to the available data) and Abstracts Views on Vision4Press platform.
Data correspond to usage on the plateform after 2015. The current usage metrics is available 48-96 hours after online publication and is updated daily on week days.
Initial download of the metrics may take a while.