Fig. 8
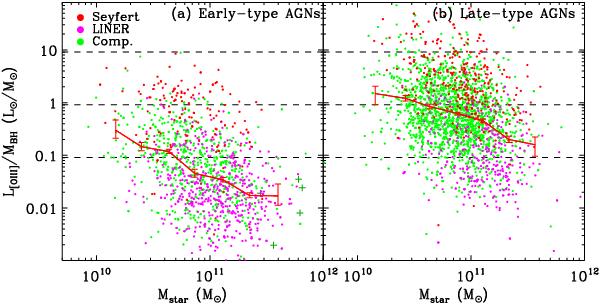
L [OIII] /MBH vs. stellar masses for (left) early- and (right) late-type galaxies. Solid line is the median curve of each sample. Seyfert, LINERs, and composite galaxies are denoted by red, pink, and green colored symbols. Dashed lines from top to bottom indicate the constant Lbol/Ledd = 1, 0.1, and 0.01 by assuming a bolometric correction 3500 for L [OIII] (Heckman et al. 2004). The BCGs, marked as crosses, are not used in calculating median values. L [OIII] and Mstar are computed with H0 = 70 km s-1 Mpc-1.
Current usage metrics show cumulative count of Article Views (full-text article views including HTML views, PDF and ePub downloads, according to the available data) and Abstracts Views on Vision4Press platform.
Data correspond to usage on the plateform after 2015. The current usage metrics is available 48-96 hours after online publication and is updated daily on week days.
Initial download of the metrics may take a while.