Fig. 2
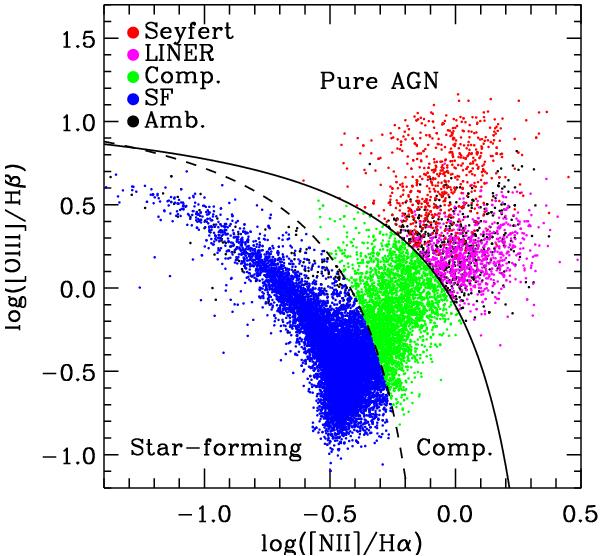
[OIII]/Hβ vs. [NII]/Hα line ratio diagram for our sample galaxies. Different spectral types following the scheme of Kewley et al. (2006) are represented by different colored symbols (Seyfert: red, LINER: pink, composite: green, SF: blue, ambiguous: black). The solid and dashed lines indicate the extreme starburst (Kewley et al. 2001) and pure SF limits (Kauffmann et al. 2003a), respectively.
Current usage metrics show cumulative count of Article Views (full-text article views including HTML views, PDF and ePub downloads, according to the available data) and Abstracts Views on Vision4Press platform.
Data correspond to usage on the plateform after 2015. The current usage metrics is available 48-96 hours after online publication and is updated daily on week days.
Initial download of the metrics may take a while.