Fig. 5
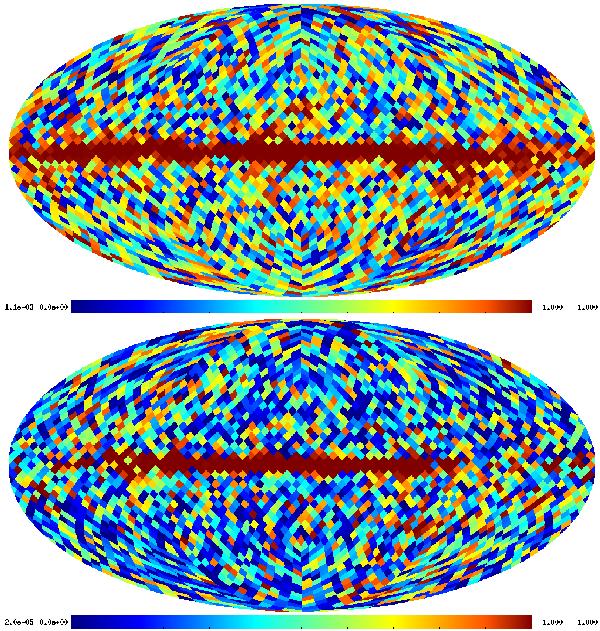
nside 16 map of P(x < K) based on pixels from the WMAP 7 year nside 512 W-band map. This time, the K-S test is performed on the 1024 nside 512 pixels inside each nside 16 pixel instead of on disks. The upper panel uses N(0,S + N) as the theoretical distribution (by testing the whitened data against N(0,1)), while the lower panel ignores the correlations, instead using N(μ,σ2), where μ and σ are the measured mean and standard deviation of the samples. The former passes the test outside the galactic plane, while the latter fails everywhere, being biased low outside the galaxy.
Current usage metrics show cumulative count of Article Views (full-text article views including HTML views, PDF and ePub downloads, according to the available data) and Abstracts Views on Vision4Press platform.
Data correspond to usage on the plateform after 2015. The current usage metrics is available 48-96 hours after online publication and is updated daily on week days.
Initial download of the metrics may take a while.