Fig. 4
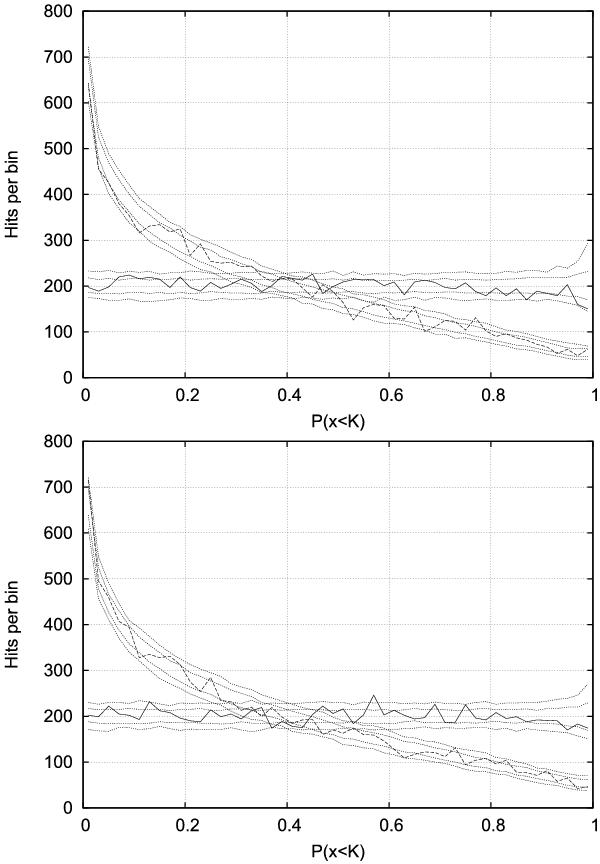
Histogram of results of the K-S test. Each panel compares the results from properly taking the correlations into account (solid line) with those one gets from ignoring them (dashed line), together with 68% and 95% intervals (dotted lines) from simulations. The upper panel corresponds to using samples further than 30 degrees away from the galactic equator, while the lower panel instead uses the WMAP KQ85 analysis mask. In both cases, both the map and the simulations pass the K-S test when taking the correlations into account, while if the are ignored, the K-S test fails in the same way Gurzadyan et al. (2011) reported.

Current usage metrics show cumulative count of Article Views (full-text article views including HTML views, PDF and ePub downloads, according to the available data) and Abstracts Views on Vision4Press platform.
Data correspond to usage on the plateform after 2015. The current usage metrics is available 48-96 hours after online publication and is updated daily on week days.
Initial download of the metrics may take a while.