Fig. 3
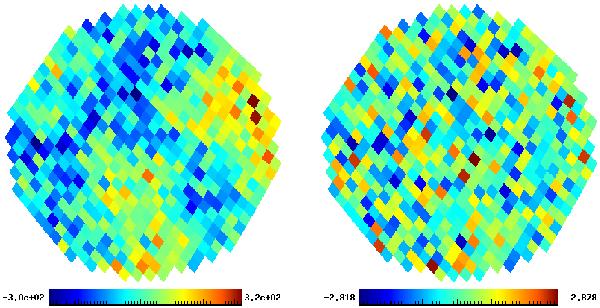
A randomly selected disk before (left) and after (right) the whitening operation. The samples are strongly correlated and thus unsuitable for the K-S test before the transformation, but afterwards no correlations are visible and the variance is 1. Note that whitening the data does not mean that we are “forcing” the K-S test to pass. The whitened data will only end up matching N(0,1) after whitening if they followed our theoretical distribution N(0,C) before.
Current usage metrics show cumulative count of Article Views (full-text article views including HTML views, PDF and ePub downloads, according to the available data) and Abstracts Views on Vision4Press platform.
Data correspond to usage on the plateform after 2015. The current usage metrics is available 48-96 hours after online publication and is updated daily on week days.
Initial download of the metrics may take a while.