Fig. 5
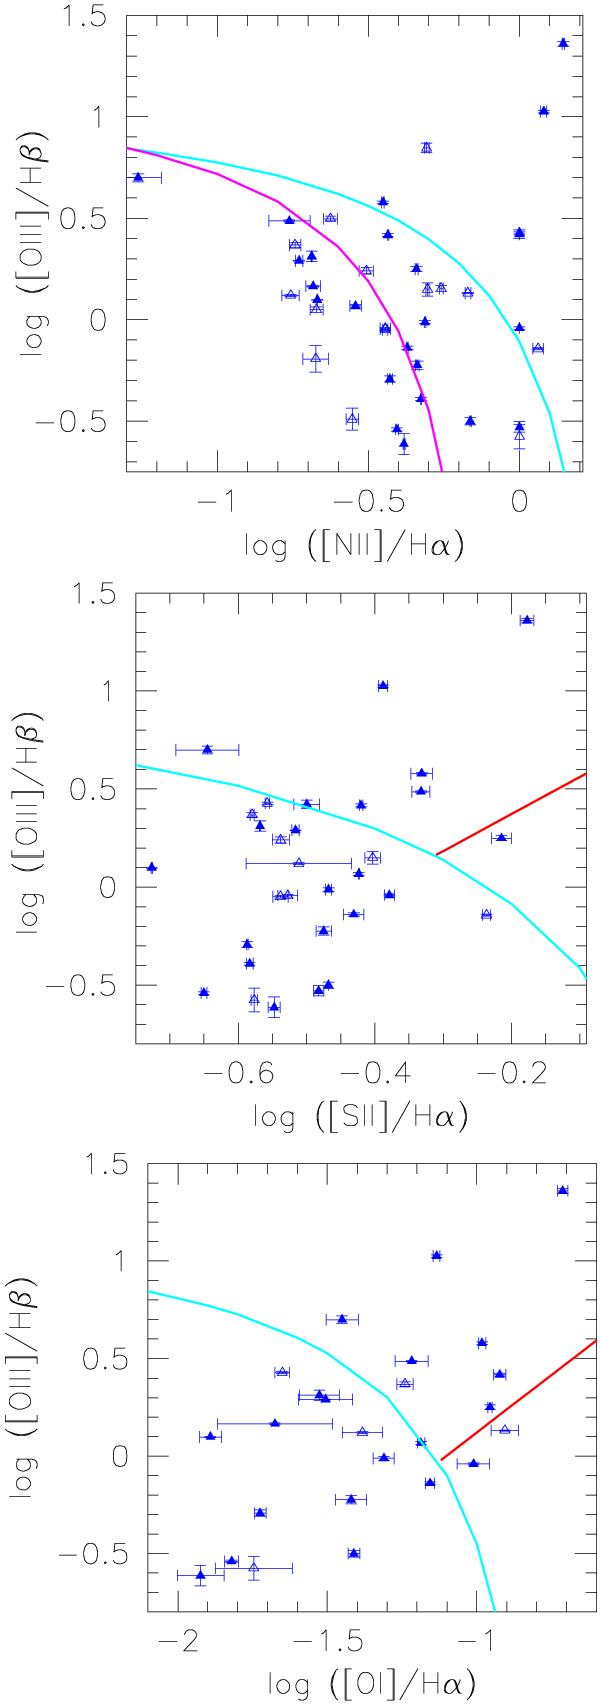
Emission line diagnostic diagrams. Galaxies belonging to the 60 μm complete sample of Mazzei et al. (2001) are represented with filled triangles; light (cyan) curves in all the three panels show the extreme starburst definition of Kewley et al. (2001); bold curve (magenta) shows the pure SF limit of Kauffmann et al. (2003); and red lines the LINER/AGN divisions from Kewley et al. (2001) and Kewley et al. (2006). Upper panel: log [OIII] λ5007/Hβ versus log [NII] λ6583/Hα. Middle panel: log [OIII] λ5007/Hβ versus log [SII] λ 6716, 6731/Hα. Lower panel: log [OIII] λ5007/Hβ versus log [OI] λ6300/Hα.
Current usage metrics show cumulative count of Article Views (full-text article views including HTML views, PDF and ePub downloads, according to the available data) and Abstracts Views on Vision4Press platform.
Data correspond to usage on the plateform after 2015. The current usage metrics is available 48-96 hours after online publication and is updated daily on week days.
Initial download of the metrics may take a while.