Fig. 6
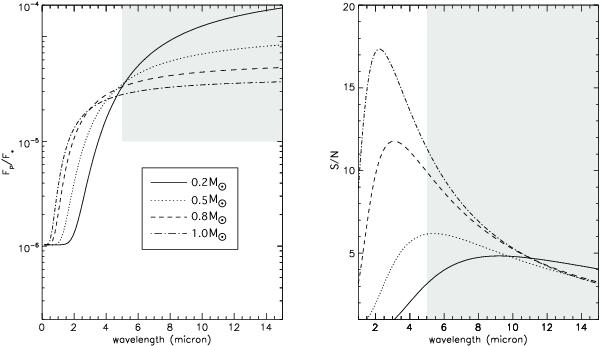
Variation spectrum as planet/star contrast (left) and S/N (right). These plots give the peak amplitude of the phase variation as a function of wavelength. The orbital distance of the planet is 0.02 AU, its radius 2 R⊕, and its inclination 60°. Each curve is for a given stellar mass. To calculate the S/N, we set Δλ = 1 μm, distance = 10 pc, telescope diameter = 1.5 m. The gray area corresponds to the 5−15 μm range (left & right) and to contrasts higher than 10-5 (left).
Current usage metrics show cumulative count of Article Views (full-text article views including HTML views, PDF and ePub downloads, according to the available data) and Abstracts Views on Vision4Press platform.
Data correspond to usage on the plateform after 2015. The current usage metrics is available 48-96 hours after online publication and is updated daily on week days.
Initial download of the metrics may take a while.