Fig. 5
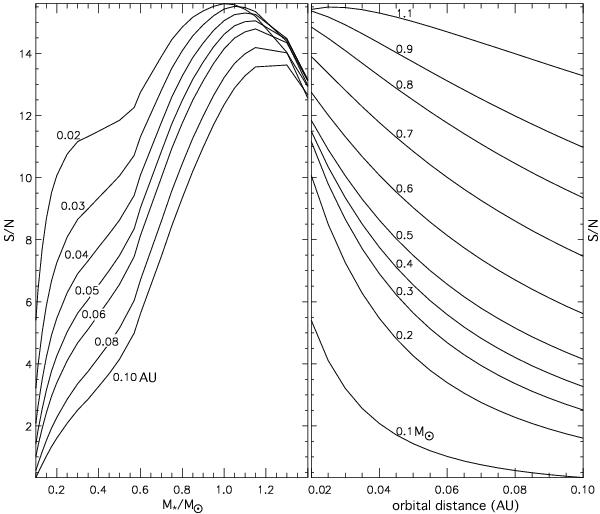
Estimated signal-to-photon-noise ratio (S/N) as a function of stellar mass and orbital period. Each curve in the left plot is for one orbital distance, and each curve on the right plot is for one stellar mass. Here, we consider the planetary signal to be the peak amplitude of the phase curve, integrated from 5 to 15 μm intervals. The duration of the two data bins used to compute the peak amplitude is set to 1/20th of the orbital period, the inclination to 60°, the distance to 10 pc, and the telescope diameter to 1.5 m telescope.
Current usage metrics show cumulative count of Article Views (full-text article views including HTML views, PDF and ePub downloads, according to the available data) and Abstracts Views on Vision4Press platform.
Data correspond to usage on the plateform after 2015. The current usage metrics is available 48-96 hours after online publication and is updated daily on week days.
Initial download of the metrics may take a while.